Things on this page are fragmentary and immature notes/thoughts of the author. Please read with your own judgement!
** Things on this page are fragmentary and immature notes/thoughts of the author. Please read with your own judgement! **
import matplotlib.pyplot as plt
import networkx as nx
Add Node into a Graph
graph = nx.Graph()
graph
<networkx.classes.graph.Graph at 0x7f060b4b3700>graph.add_node(1)
graph.add_node(2)graph.nodesNodeView((1, 2))set(graph.nodes){1, 2}1 in graph.nodes(1)True1 in graphTruegraph.nodes[1]{}attr = graph.nodes[1]attr["x"] = 100graph.nodes[1]{'x': 100}graph.nodes[1]{'x': 100}A node is a hashable object while the attributes of a node is a dict.
type(graph.nodes[1])dictExisting nodes and attributes are reused when adding nodes into a graph.
graph.add_node("Hello", x=10)graph.nodesNodeView((1, 'Hello'))graph.add_node("Hello", y=20)graph.nodes["Hello"]{'x': 10, 'y': 20}graph.add_node(("http://github.com/dclong/xinstall", "master"))graph.nodesNodeView((1, 'Hello', ('http://github.com/dclong/xinstall', 'master')))graph.nodes[("http://github.com/dclong/xinstall", "master")]{}Add Edge into a Graph
Adding an edge into a graph automatically add the nodes of the edge into the graph.
graph = nx.Graph()
graph
<networkx.classes.graph.Graph at 0x1397f0670>graph.add_edge(1, 2)graph.nodesNodeView((1, 2))graph.edgesEdgeView([(1, 2)])graph.edges[(1, 2)]{}Existing node is reused when creating an edge.
graph = nx.Graph()
graph
<networkx.classes.graph.Graph at 0x1397f0220>graph.add_node(1, x=10)graph.add_edge(1, 2)graph.nodes---------------------------------------------------------------------------
NameError Traceback (most recent call last)
<ipython-input-1-666954a34ddf> in <module>
----> 1 graph.nodes
NameError: name 'graph' is not definedgraph.nodes[1]{'x': 10}DiGraph
graph = nx.DiGraph()
graph
<networkx.classes.digraph.DiGraph at 0x131afd7c0>Get Predecessors/Parents
graph.add_edge(1, 2)
graph.add_edge(3, 2)list(graph.predecessors(2))[1, 3]Get Successors/Children
list(graph.successors(1))[2]Visualization
graph = nx.Graph()graph.add_edge("a", "b", weight=0.6)
graph.add_edge("a", "c", weight=0.2)
graph.add_edge("c", "d", weight=0.1)
graph.add_edge("c", "e", weight=0.7)
graph.add_edge("c", "f", weight=0.9)
graph.add_edge("a", "d", weight=0.3)elarge = [(u, v) for (u, v, d) in graph.edges(data=True) if d["weight"] > 0.5]
elarge[('a', 'b'), ('c', 'e'), ('c', 'f')]esmall = [(u, v) for (u, v, d) in graph.edges(data=True) if d["weight"] <= 0.5]
esmall[('a', 'c'), ('a', 'd'), ('c', 'd')]fig, ax = plt.subplots(1, 1, figsize=(8, 6))
nx.draw_networkx(graph, ax=ax)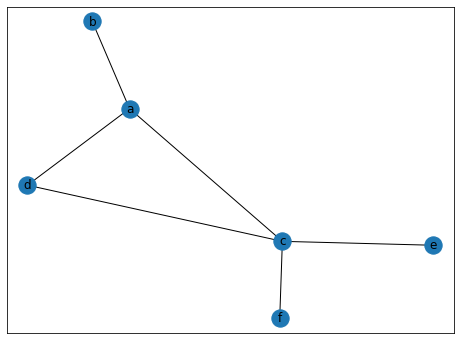
fig.savefig("/workdir/networkx.png")Visualization
https://
pos = nx.spring_layout(graph)
pos
{'a': array([-0.52190174, 0.09425555]),
'b': array([-1. , 0.32564189]),
'c': array([ 0.40979282, -0.01115702]),
'd': array([-0.39569899, -0.45872164]),
'e': array([0.75723908, 0.36174601]),
'f': array([ 0.75056884, -0.31176479])}nx.draw_networkx_nodes(graph, pos, node_size=700)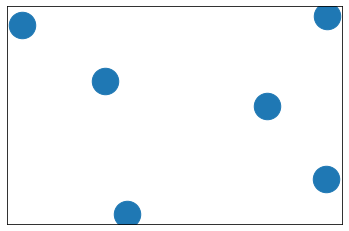
nx.draw_networkx_edges(graph, pos, edgelist=elarge, width=6)
nx.draw_networkx_edges(
    graph, pos, edgelist=esmall, width=6, alpha=0.5, edge_color="b", style="dashed"
)
nx.draw_networkx_labels(graph, pos, font_size=20, font_family="sans-serif"){'a': Text(-0.5219017365690998, 0.09425554685676928, 'a'),
'b': Text(-1.0, 0.32564189274221367, 'b'),
'c': Text(0.4097928153942144, -0.01115702318855791, 'c'),
'd': Text(-0.3956989937868261, -0.4587216373044083, 'd'),
'e': Text(0.757239076476884, 0.3617460091278071, 'e'),
'f': Text(0.7505688384848274, -0.3117647882338241, 'f')}
plt.axis("off")
plt.show()
import json
import numpy as np
import networkx as nx
import matplotlib.pyplot as plt
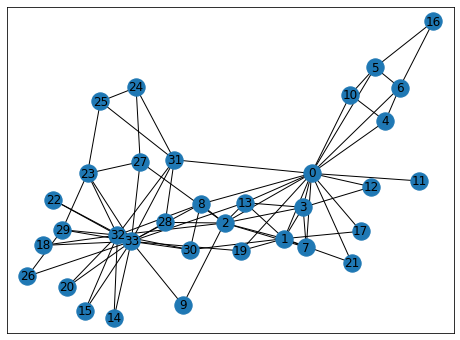
%matplotlib inlineg = nx.karate_club_graph()
fig, ax = plt.subplots(1, 1, figsize=(8, 6))
nx.draw_networkx(g, ax=ax)